
Cloud Native Observability: Log Management
As logs often contain very valuable information, log management represents an important part of cloud native observability. Logs feature a standard output (stdout) in containers and Kubernetes, which is different from physical machines or virtual machines. This means the collection, analysis and management of logs at the platform level can be carried out in a unified fashion, which demonstrates the unique value of logs. This article introduces a major solution to log management (EFK) in the cloud native area, FluentBit Operator developed by the KubeSphere team and some practices of KubeSphere in multi-tenant log management. Besides, the article also elaborates on an open source tool Loki, a low-cost and extensible application inspired by Prometheus and developed specifically for the log management of Kubernetes.
What is Observability
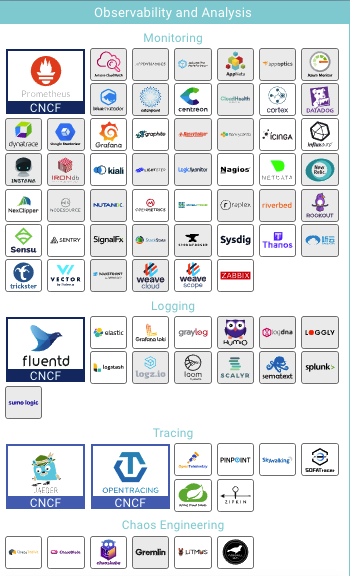
Cloud native technologies have emerged in recent years with Kubernetes as a standout among them. Against this background, observability has come to people’s awareness as a new concept. The Cloud Native Computing Foundation (CNCF) has put observability as a separate category in its Landscape. In a narrow sense, observability mainly entails monitoring, logging and tracking. Broadly speaking, it covers alert, event and audit. Emerging open source software has sprung out in flocks in the area, such as Prometheus, Grafana, Fluentd, Loki and Jaeger.
As an essential part of observability, logs play an important role in development, operation and maintenance, test and audit. The famous Twelve-Factor App mentions that “Logs provide visibility into the behavior of a running app. A twelve-factor app never concerns itself with routing or storage of its output stream. It should not attempt to write to or manage logfiles. Instead, each running process writes its event stream, unbuffered, to stdout. In staging or production deploys, each process' stream will be captured by the execution environment, collated together with all other streams from the app, and routed to one or more final destinations for viewing and long-term archival.”
In the environment of physical or virtual machines, logs are generally exported as files and managed by users. This makes it difficult for centralized management and analysis. On the contrary, container technologies, such as Kubernetes and Docker, can export logs directly to stdout, providing great convenience for the centralized management and analysis of logs.
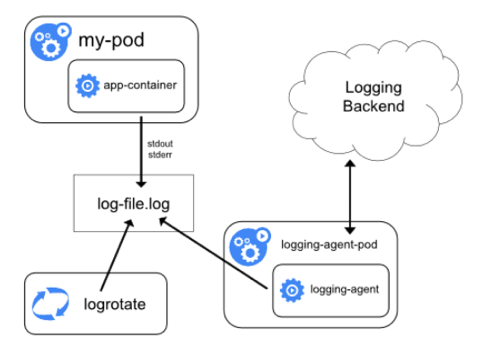
The general logging architecture offered by the official website of Kubernetes is shown below, including logging agent, backend services and frontend console. Mature solutions (e.g. ELK/EFK) and the open source tool Loki launched in 2018 in the cloud native area share a similar architecture. More details will be provided below on the contribution of ELK/EFK, Loki and KubeSphere in this regard.
Meet the New Member: ELK to EFK, Fluentd to Fluent Bit
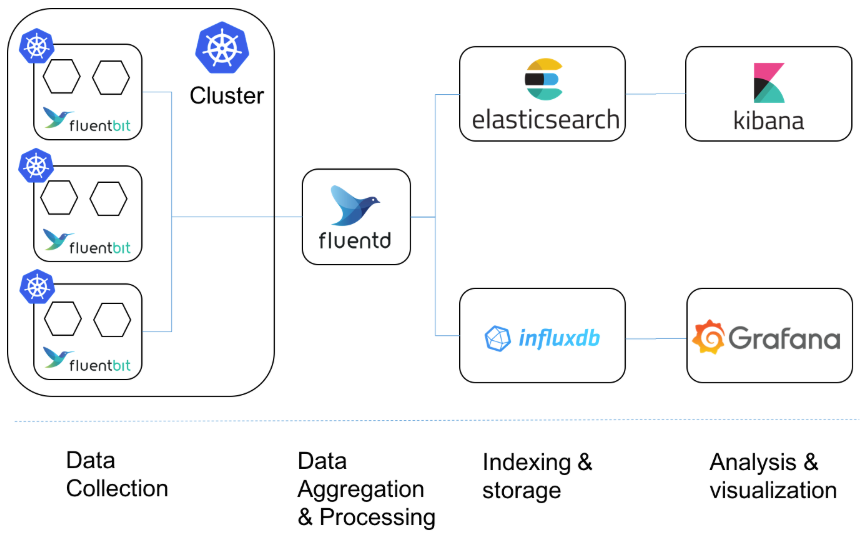
ELK, the abbreviation for Elasticsearch, Logstash and Kibana, is currently the mainstream open source logging solution. Fluentd, written in a mix of C and Ruby, became a graduated project of CNCF in April 2019. This easy-to-use data collector for unified logging layer features efficiency and flexibility, as it has gradually replaced Logstash written in Java as an important member of EFK, the new logging solution. Fluentd has also gained widespread cognition and application in the cloud native field. Furthermore, Google has modified Fluentd to use it as the Agent in its cloud logging service. That said, the development team of Fluentd did not mark time and released a much more lightweight product Fluent Bit, which is completely written in C. Here is a comparison of them:
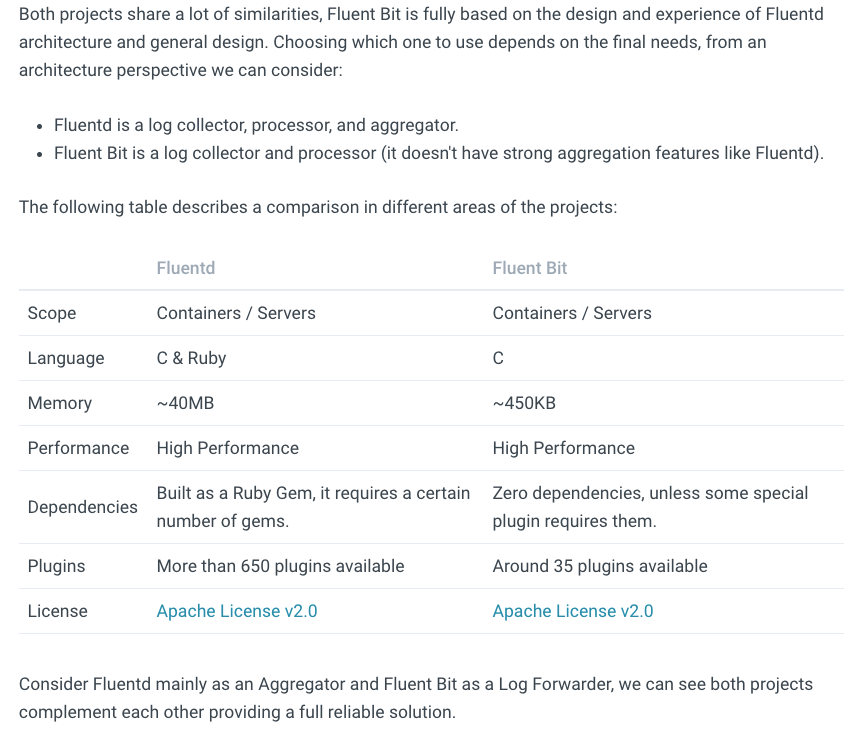
It can be seen that Fluent Bit turns out to be a better log collector as it uses fewer resources than Fluentd. On the other hand, Fluentd is equipped with more plugins and it is more appropriate to be used as a log aggregator.
FluentBit Operator and its Application in KubeSphere
Fluent Bit also has its own problems though it is more lightweight and efficient: after the configuration file is changed, the new configuration cannot be loaded automatically. Please refer to the official website in Github: #PR 842 and #issue 365.
To solve the problems above, the KubeSphere development team has developed FluentBit Operator and applied it to KubeSphere as the log collector. Here is how FluentBit Operator works:
-
Include the FluentBit Controller process in the main Container of FluentBit Pod to control the start and stop of the FluentBit main process;
-
Add the ConfigMap Reload Sidecar Container to monitor the change in ConfigMap in which the FluentBit configuration file is located. When a change happens, call the reload interface of FluentBit Controller: http://localhost:24444/api/config.reload.
-
FluentBit Controller will restart the main process of FluentBit to load the new configuration file.
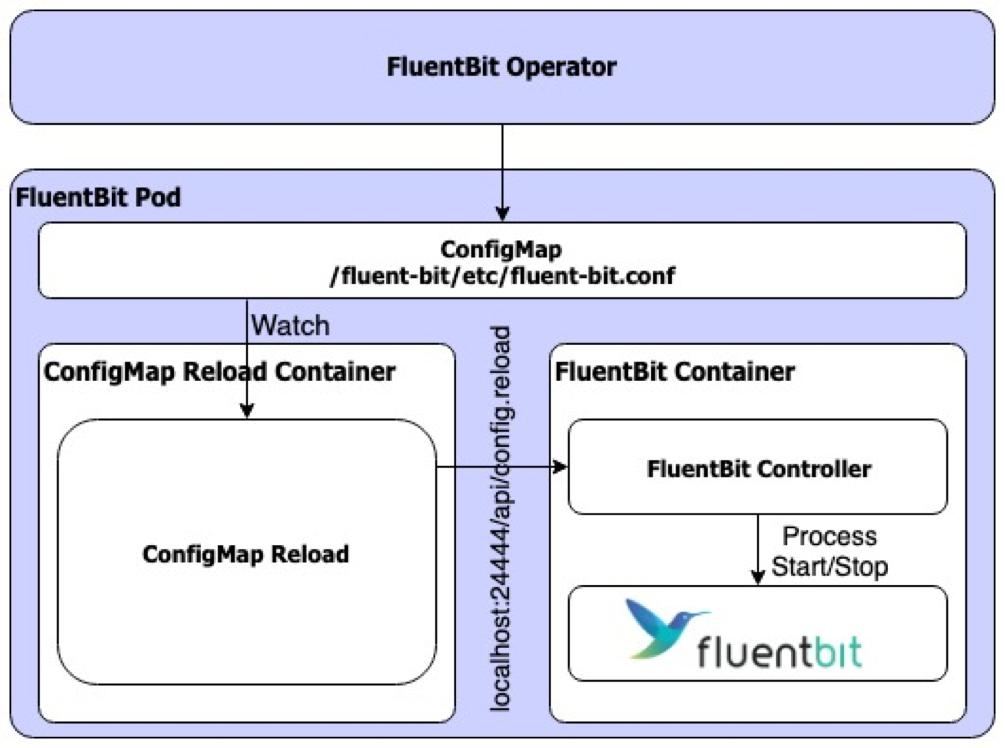
FluentBit Operator Architecture
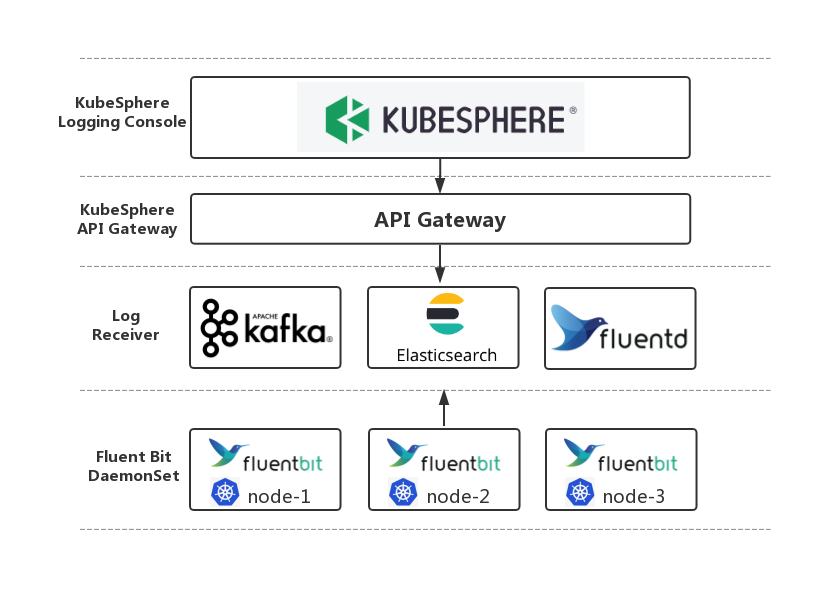
In KubeSphere, Elasticsearch serves as the backend logging service, with Fluent Bit as the log collector. The KubeSphere Logging Console controls the configuration of Fluent Bit in FluentBit CRD through FluentBit Operator. Alternatively, users can also change the FluentBit configuration through kubectl edit fluentbit fluent-bit in a native way of Kubernetes.
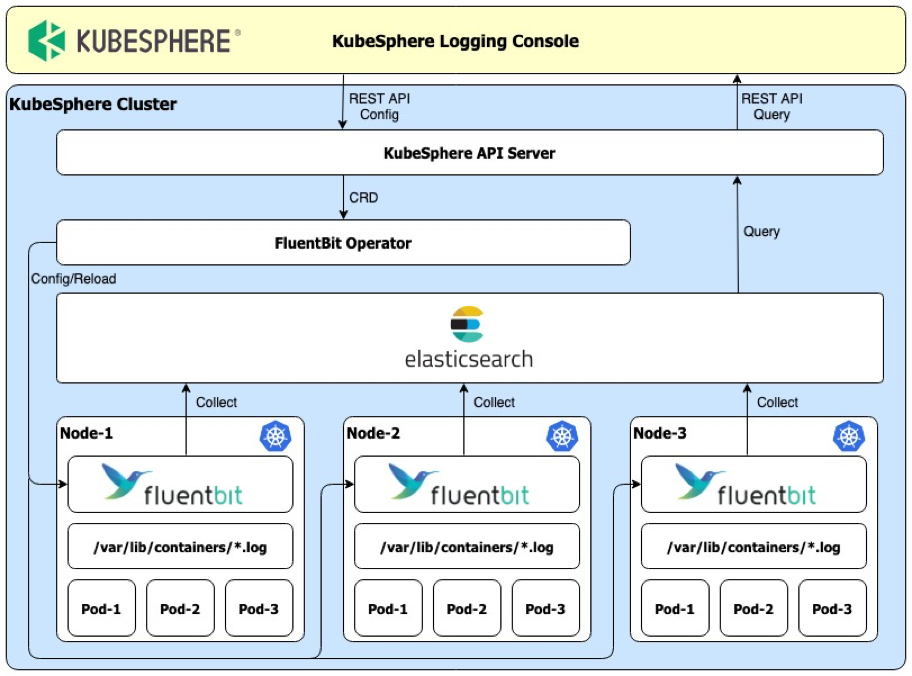
KubeSphere Log System Architecture
FluentBit Operator provides great flexibility for KubeSphere in the addition/deletion/suspension/configuration of log receivers through the console.
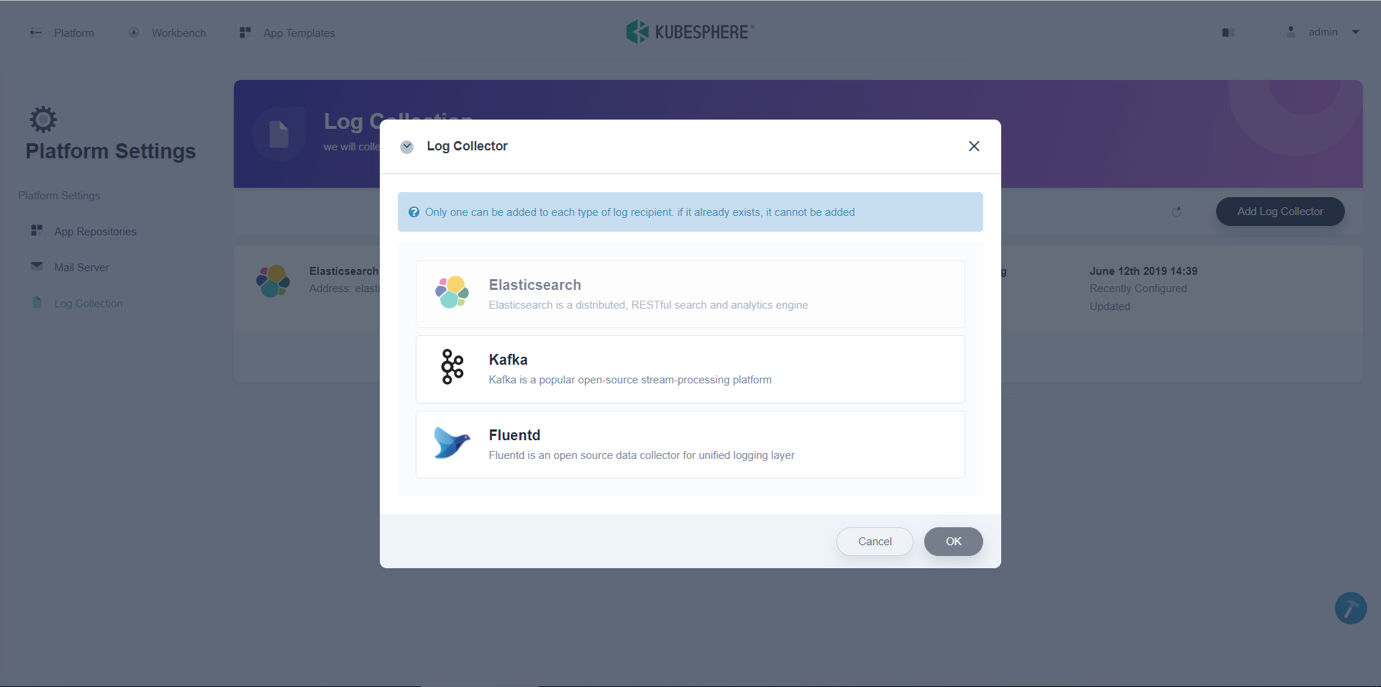
KubeSphere Log Configuration Interface
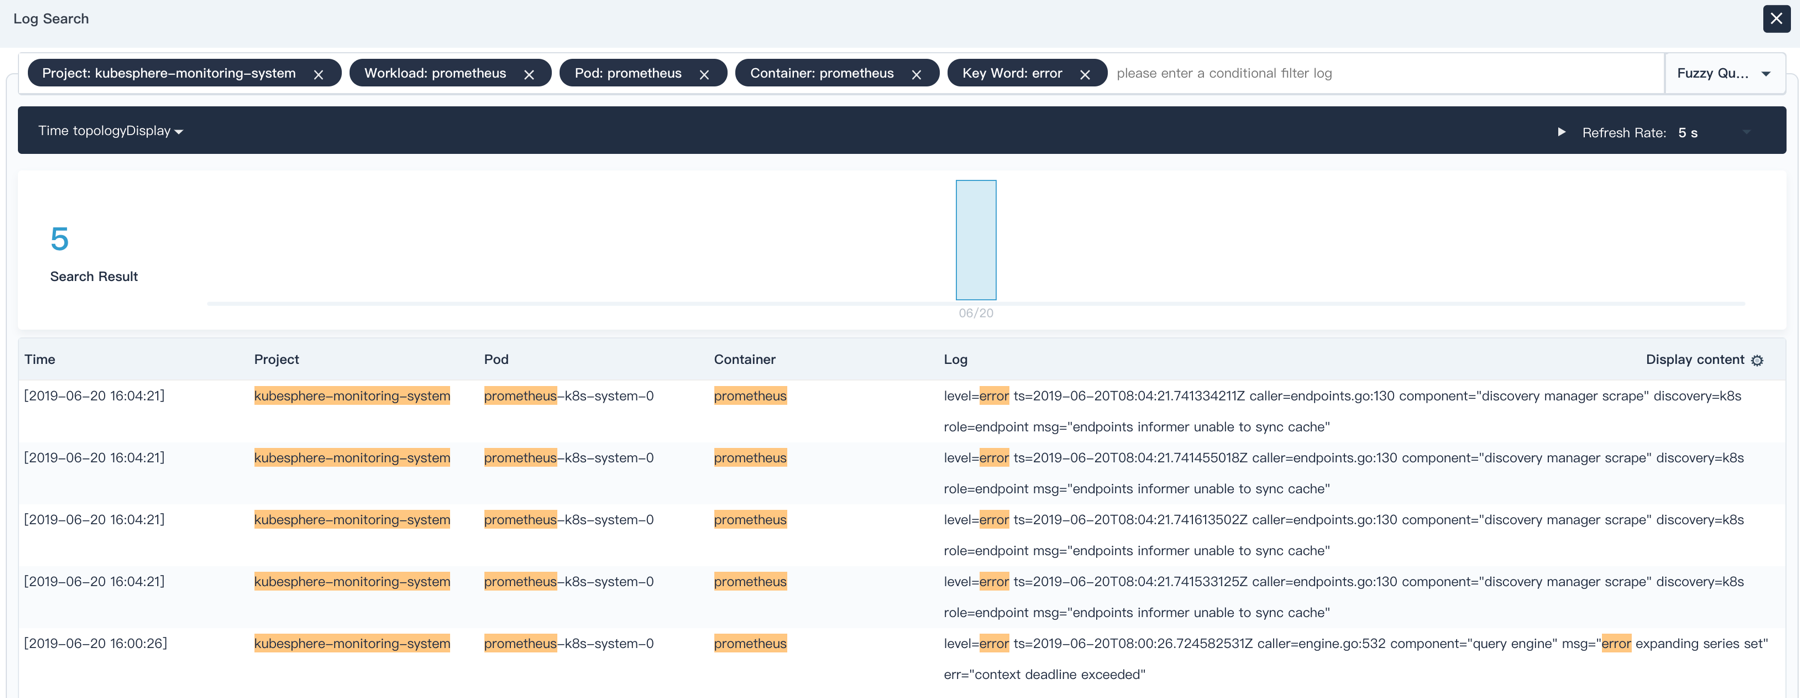
KubeSphere Log Search Interface
Multi-Tenant Log Management
The Kubernetes community has paid much attention to the feature of multi-tenancy, with a wide range of solutions available to use, such as soft multi-tenancy and hard multi-tenancy. The specific approach to log management also differs. In Loki, multi-tenancy is supported through the Tenant ID while KubeSphere achieves tenant isolation through workspaces. Now, let’s take a quick look at some practices of KubeSphere in multi-tenant log management (In KubeSphere v2.1, great enhancements were made in its logging function, such as a better support of Chinese log search and automatic sidecar injection for the collection of logs in the disk).
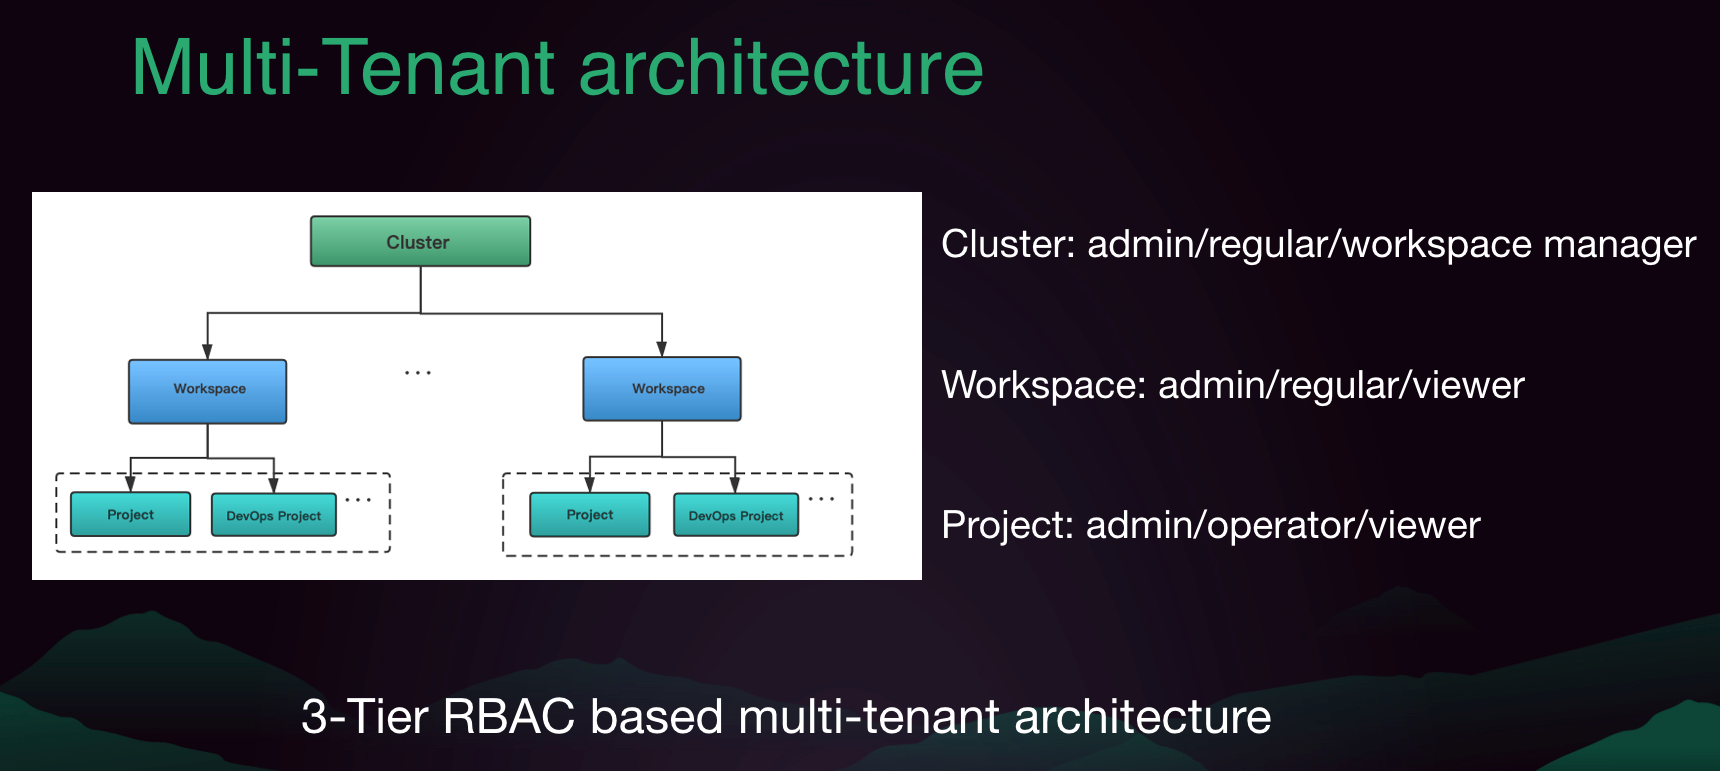
It can be seen below that KubeSphere boasts a 3-tier multi-tenant architecture based on RBAC, with different roles in Cluster, Workspace and Project respectively.
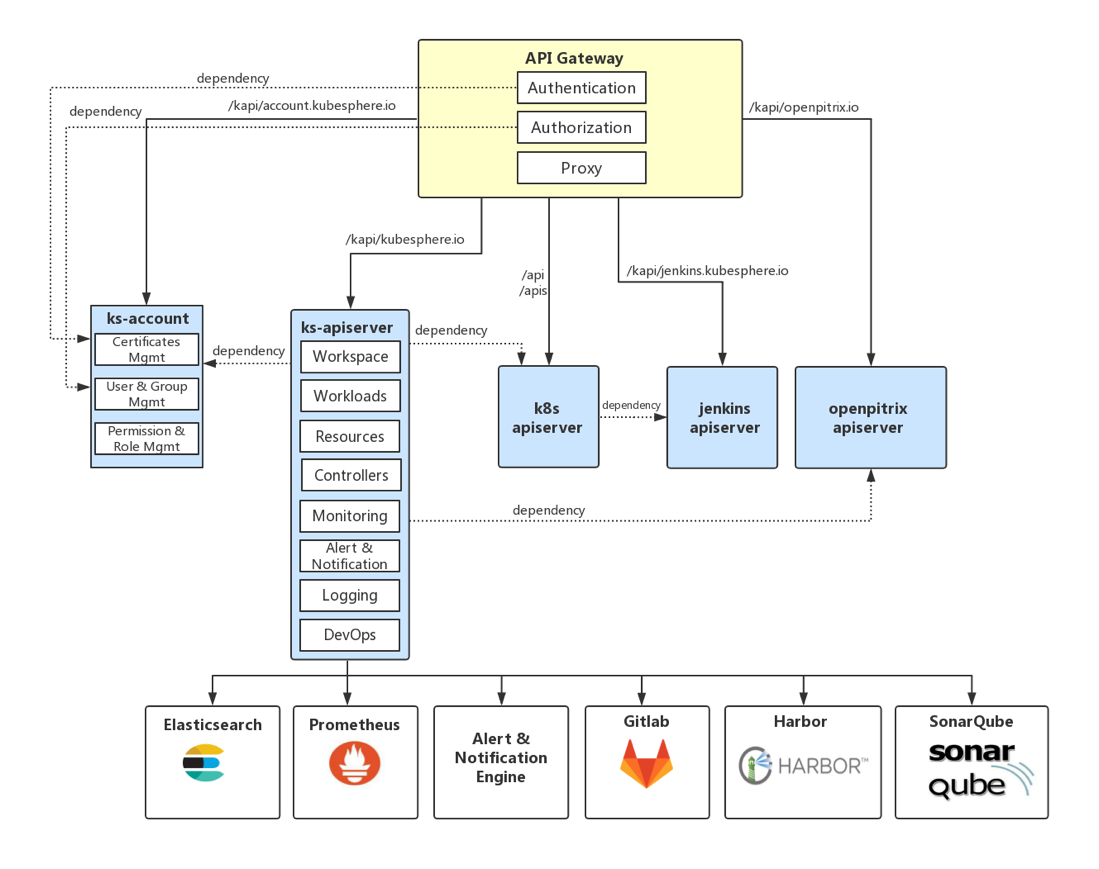
The authentication and authorization of API Gateway is needed before the log data (or other services) can be accessed.
The entire logging solution in KubeSphere is shown as below:
Loki: Born for Cloud Natives, Designed for Logs
Although ELF/EFK is a popular logging solution, it also has a well-known weakness: it takes up excessive resources (both memory and disk storage). This is because Elasticsearch features a full-text index of the data for a rapid search. However, this is not necessary for log data in most cases. Besides, as Elasticsearch is developed in Java, the programming language Go in the cloud native field runs better than Elasticsearch in both efficiency and resource usage.
The cloud native industry has waited so long for a log management application written in Go before Loki finally comes to satisfy the need. 10 months after its release in December, 2018, the number of Star in Github had topped 7,000. Loki is created by Grafana Labs, the same development team of Grafana which boasts developers of the famous cloud native monitoring application Prometheus and provides the monitoring service Cortex in cloud. As Loki is a product inspired by Prometheus, they share plenty of similar characteristics: they are closely integrated into Kubernetes and share the same Label; the query language of Loki (LogQL) has similar grammar with Prometheus; and their query functions are also alike. The log data of Loki can also be directly checked and searched in Grafana. In addition, Loki share many components with Cortex, making it very easy for horizontal scaling.
The most prominent feature of Loki is that it takes up few resources with a low storage cost. In this regard, Loki is designed this way to solve the problem of using excessive resources of Elasticsearch. It compresses and stores the stream data of logs by simply indexing metadata (such as labels). When a user searches the log text through the label to narrow down the range, stream data will be decompressed and filtered through a grep-like mechanism. As it can be seen below, the components include the agent Promtail for data collection, Distributor for data reception, Ingester for caches and batch writing, and Querier for data query. All these components can be horizontally scaled with high availability according to the load condition.
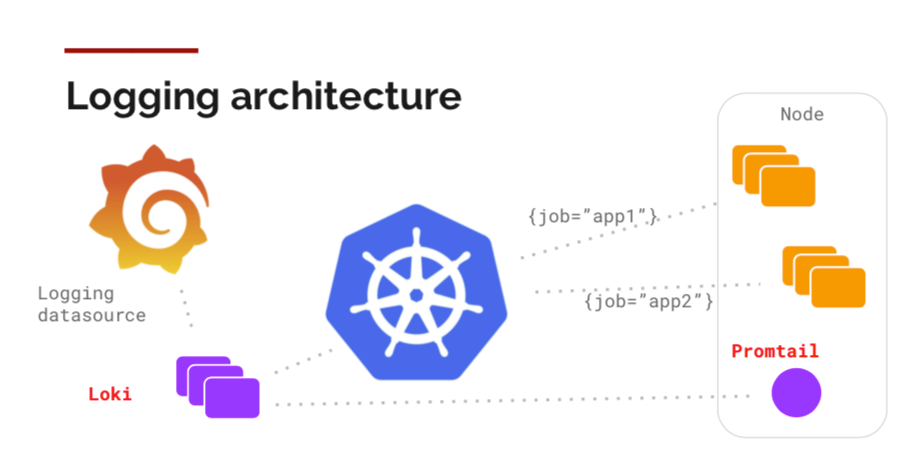
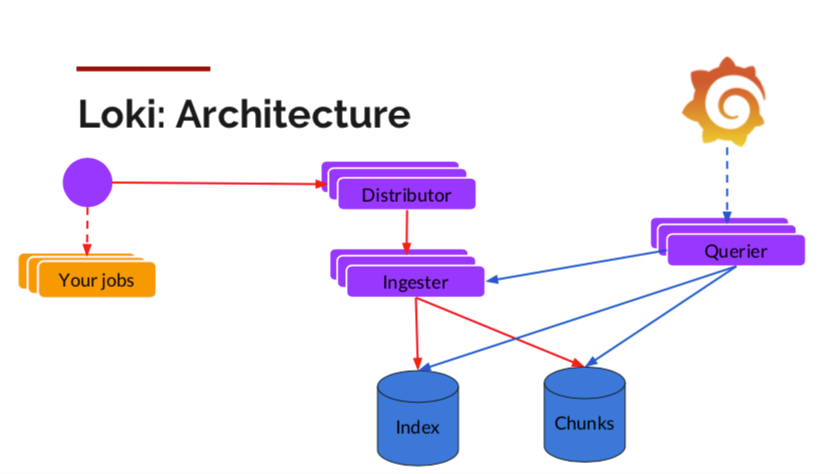 Loki Architecture (Source: official blog of Grafana Labs)
With Loki, the data of Index and chunks are stored in different media as shown below. The Index can be stored in Cassandra and BoltDB while the chunks can be saved in a local disk, through cloud object storage or Minio that supports the S3 protocol. That means a large number of log data can be stored at a low cost on the one hand and the need of users for rapid log search can be met on the other.
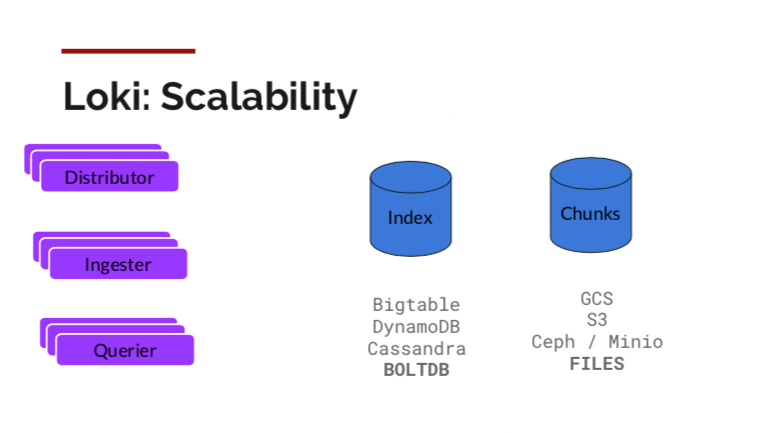
Loki Storage (Source: official blog of Grafana Labs)
As a logging solution that answers the call of the cloud native times, Loki has quickly come to the spotlight as it features low cost, great scalability and high availability, and close integration with Kubernetes and Prometheus. It is expected to be on a par with Prometheus as the preferred solution to cloud native log management.
Prospect
The way Kubernetes is structured makes it possible for the centralized management of logs. In this connection, an increasing number of outstanding log management methods have empowered users to better dig out the value of log data, with greater observability achieved. As an open source platform based on Kubernetes, KubeSphere will work to improve the existing logging solutions of Kubernetes (e.g. multi-cluster log management and log alert). On top of that, it will also pay close and continuous attention to Loki, the log aggregation system inspired by Prometheus, and strives to be an active player in its development. This is how it works to integrate the most cutting-edge technology of log management into KubeSphere for users around the world.
Relevant Information
In KubeCon held in Shanghai, June 2019, a keynote speech Effective Logging In Multi Tenant Kubernetes Environment was shared on multi-tenant log management. Please see relevant PPT in the official website of CNCF.


